Data documentation will ensure that your data will be understood and interpreted by any user. It will explain how your data were created, the context for the data, the structure of the data and their contents, and any manipulations to the data.
Weill Cornell Medicine (WCM) is continuously looking to promote the understanding of new regulations released by federal funding agencies pertaining to data management and sharing, and to help researchers comply.
Below are some of the classes and training videos the Library offers. Click on the class title for additional information or to watch a recorded training.
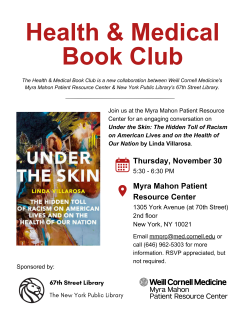
The Health & Medical Book Club is a new collaboration between Weill Cornell Medicine's Myra Mahon Patient Resource Center & New York Public Library's 67th Street Library.
Join Ayah Nuriddin at 5PM EST on Tuesday, November 7, 2023, as she examines the complex and often paradoxical ways in which African Americans imagined the utility of racial science and eugenics for challenging scientific raism and advocating for racial equality. Her lecture will trace how the ongoing legacies of racial science continue to shape African American articulations of racial formation and health disparities, in addition to activism around health inequality.
I'd like to donate books to the library.
Thank you for thinking of the Wood Library. Currently, we don't accept print book donations, as we are transitioning most of our print collection to e-books. We are only acquiring print if that is the only available format and the book is needed for research or teaching purposes. If the book is rare, unique, and historically significant, consider contacting the New York Public Library. Click here for information about NYPL’s donation policy.
Does the Library have a projector available for checkout?
The Library has a projector available for checkout. The projector comes with a remote, power cable and a thunder bolt to thunderbolt/vga dongle connection.
Can I post flyers in the Library?
We reserve whatever space we may have inside the Library for internal postings pertaining to the college or the Library. A more varied board by the hospital cafeteria sometimes has apartment postings, and you may want to ask if you can post your listings there.